Building a Functional 3D Scanner
This project involved the design, fabrication, and calibration of a 3D scanner capable of capturing objects using infrared sensing and visualizing the data in MATLAB.
View the Documentation With Code →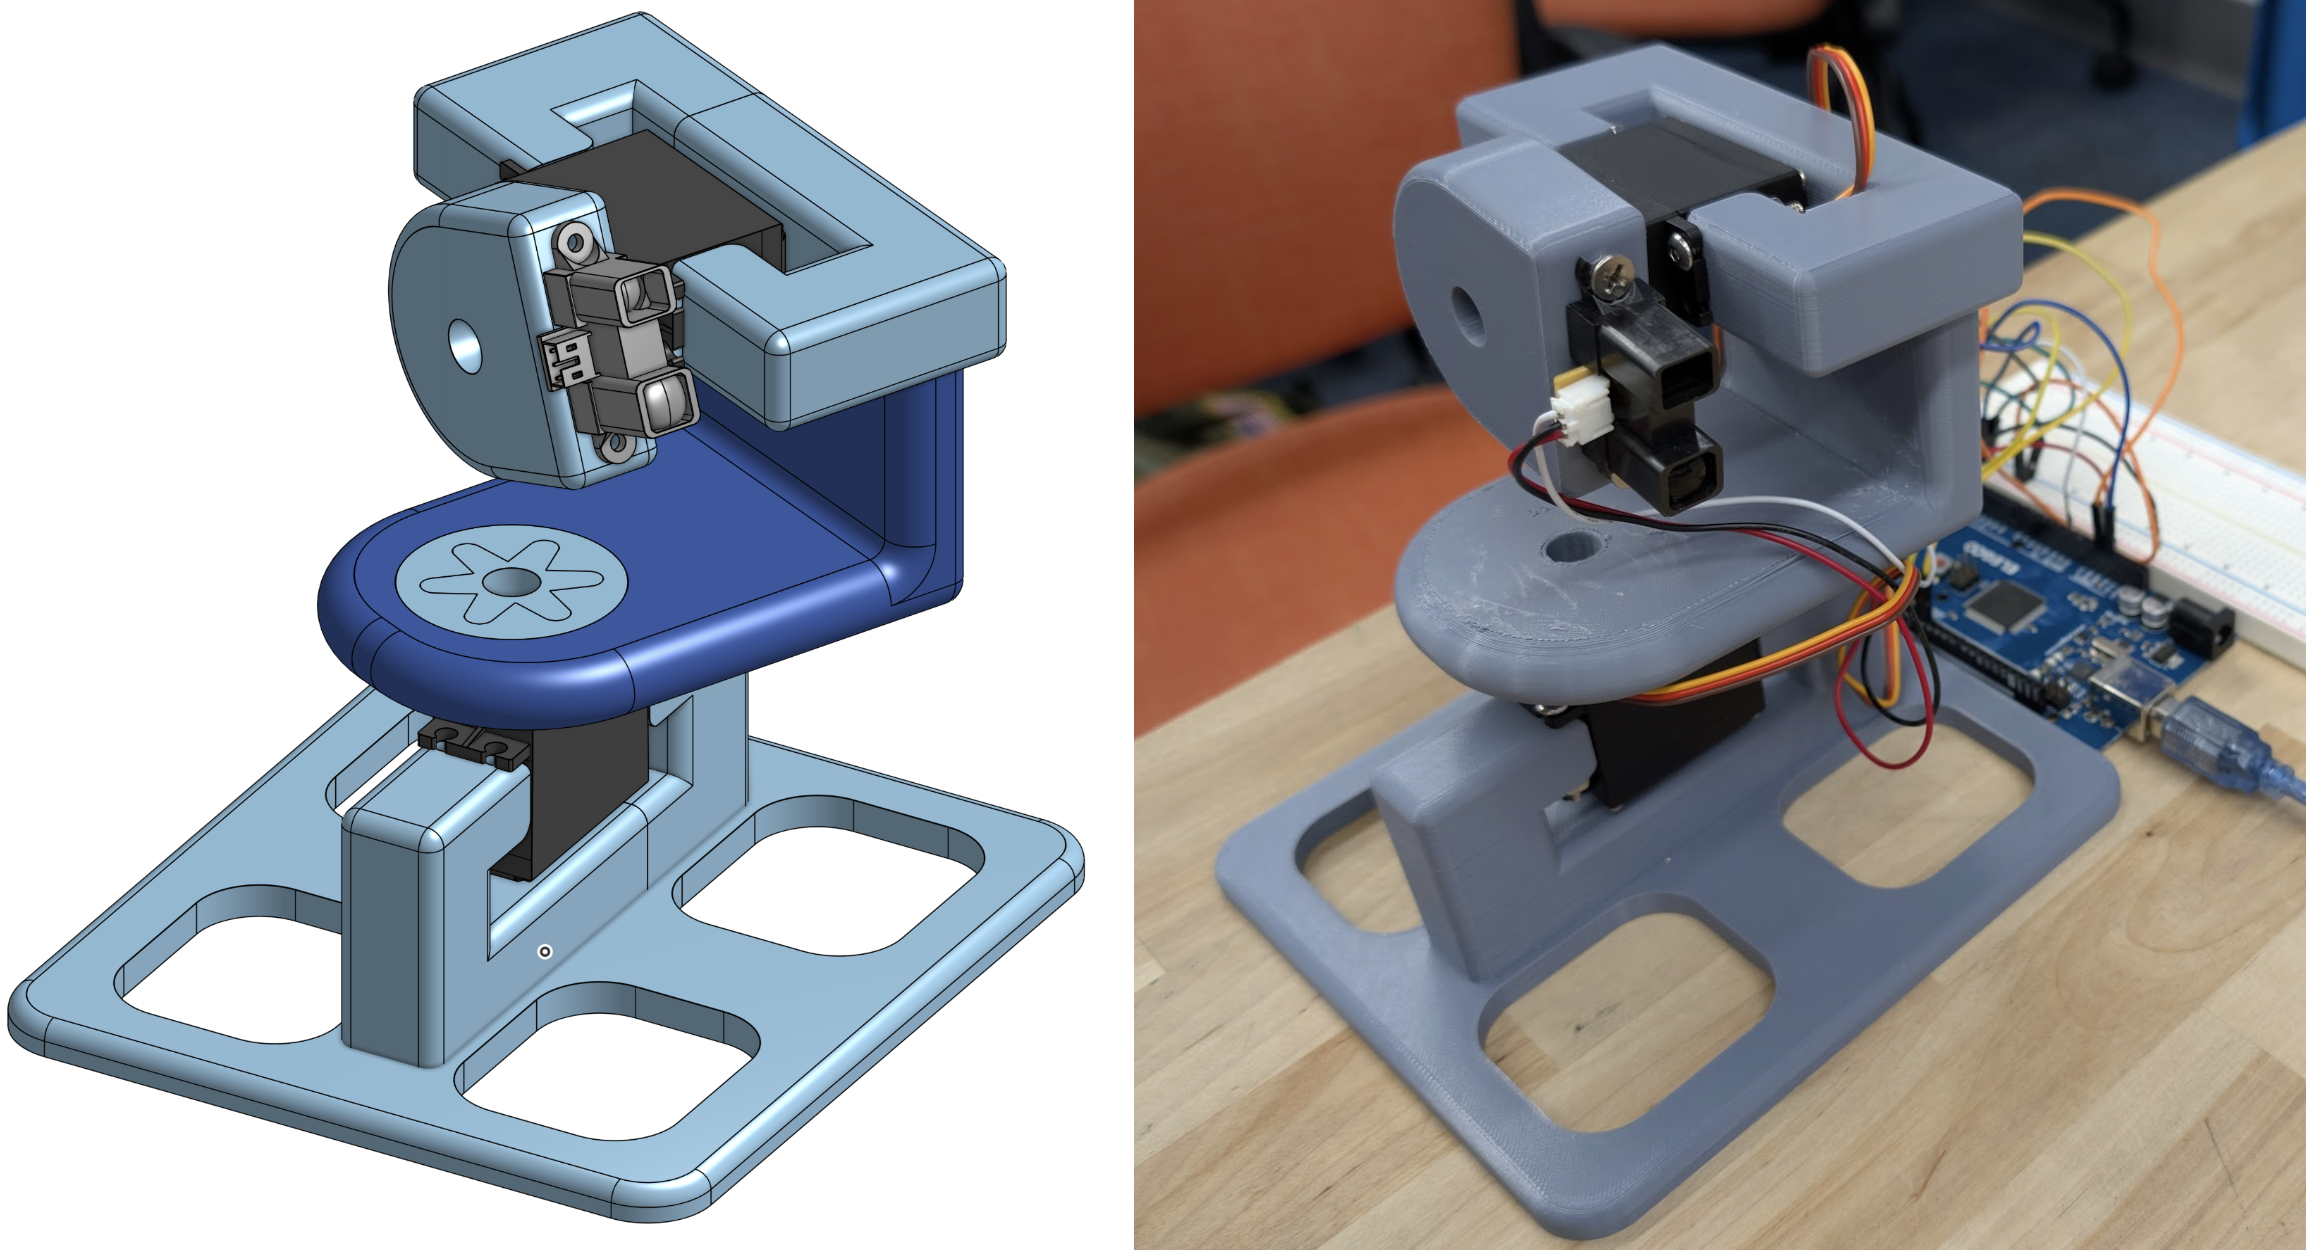
From Concept to Creation
The goal was to develop a fully functional 3D scanner from the ground up. This involved integrating an infrared distance sensor with a custom-designed pan-tilt mechanism controlled by two servo motors. By systematically moving the sensor across a grid and recording distance measurements, we aimed to create a detailed point cloud of an object, which could then be visualized as a 3D heatmap in MATLAB.
This hands-on project allowed us to apply our knowledge of sensor integration, servo control, and data visualization to a practical engineering challenge.
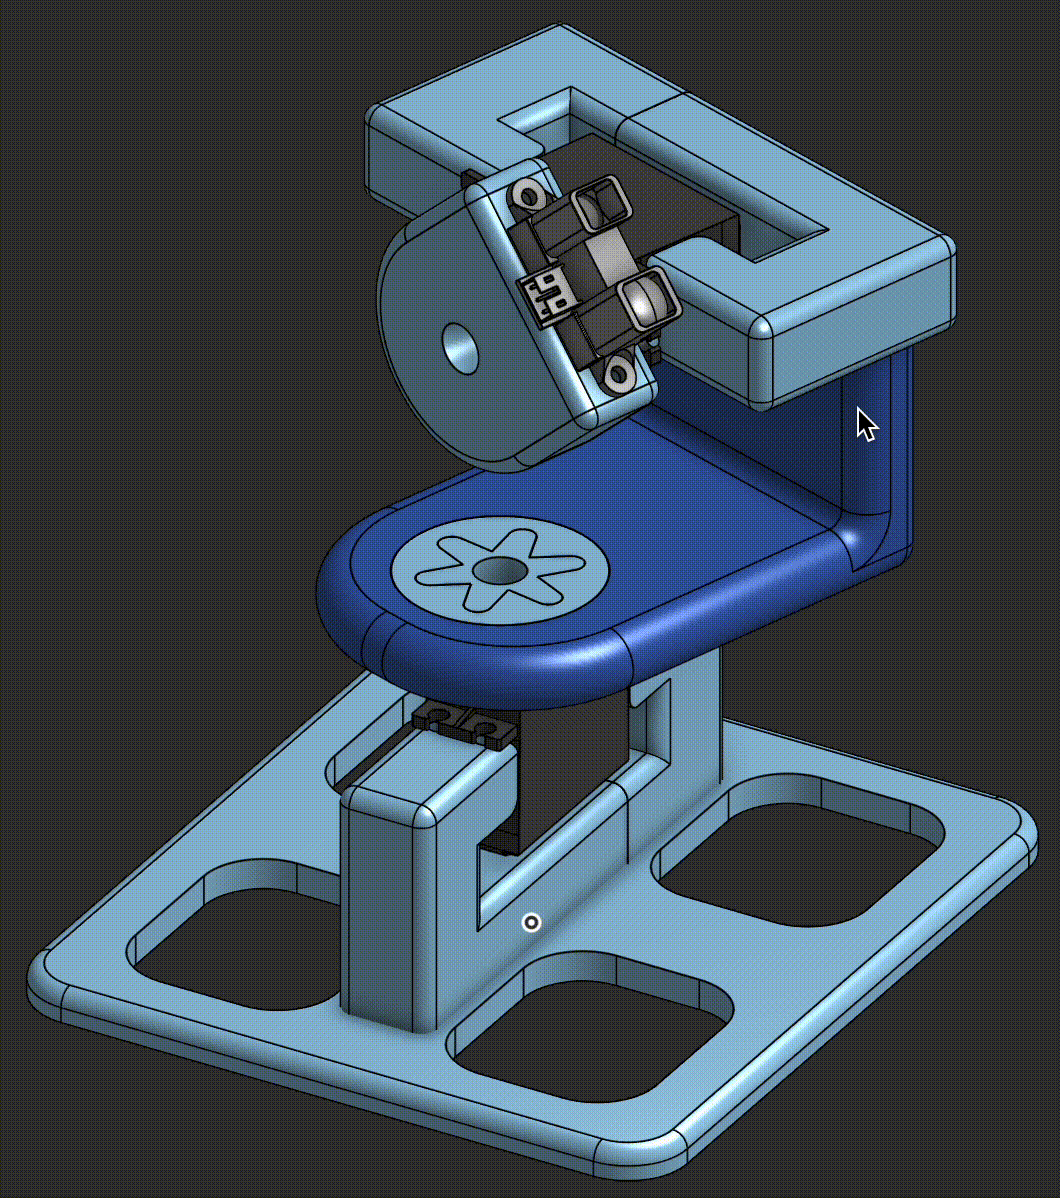
Mechanical Design & Fabrication
The core of the scanner is a 3D-printed pan-tilt mechanism, designed to provide a stable platform for the IR sensor while allowing for precise, controlled movement.
Pan-Tilt Mechanism
-
Rotational Accuracy
The design ensures the sensor rotates around a fixed point, preventing translational movement that would skew distance data. One servo controls the horizontal "pan" motion, while the other controls the vertical "tilt."
-
3D Printed Construction
The entire housing was 3D printed for ease of fabrication and to create a seamless, "plug-and-play" assembly without the need for glue or complex fasteners. The base was skeletonized to save on material and print time.
-
Design Challenge & Improvement
An unbalanced design of the top U-shaped piece led to sagging over time. A future iteration would improve balance with a counterweight or a more symmetrical design to prevent strain on the servo's press-fit connection.
Sensor Calibration
To convert the sensor's raw analog output into meaningful distance data, a precise calibration process was required. We measured the analog values at known distances and used this data to create a conversion formula.
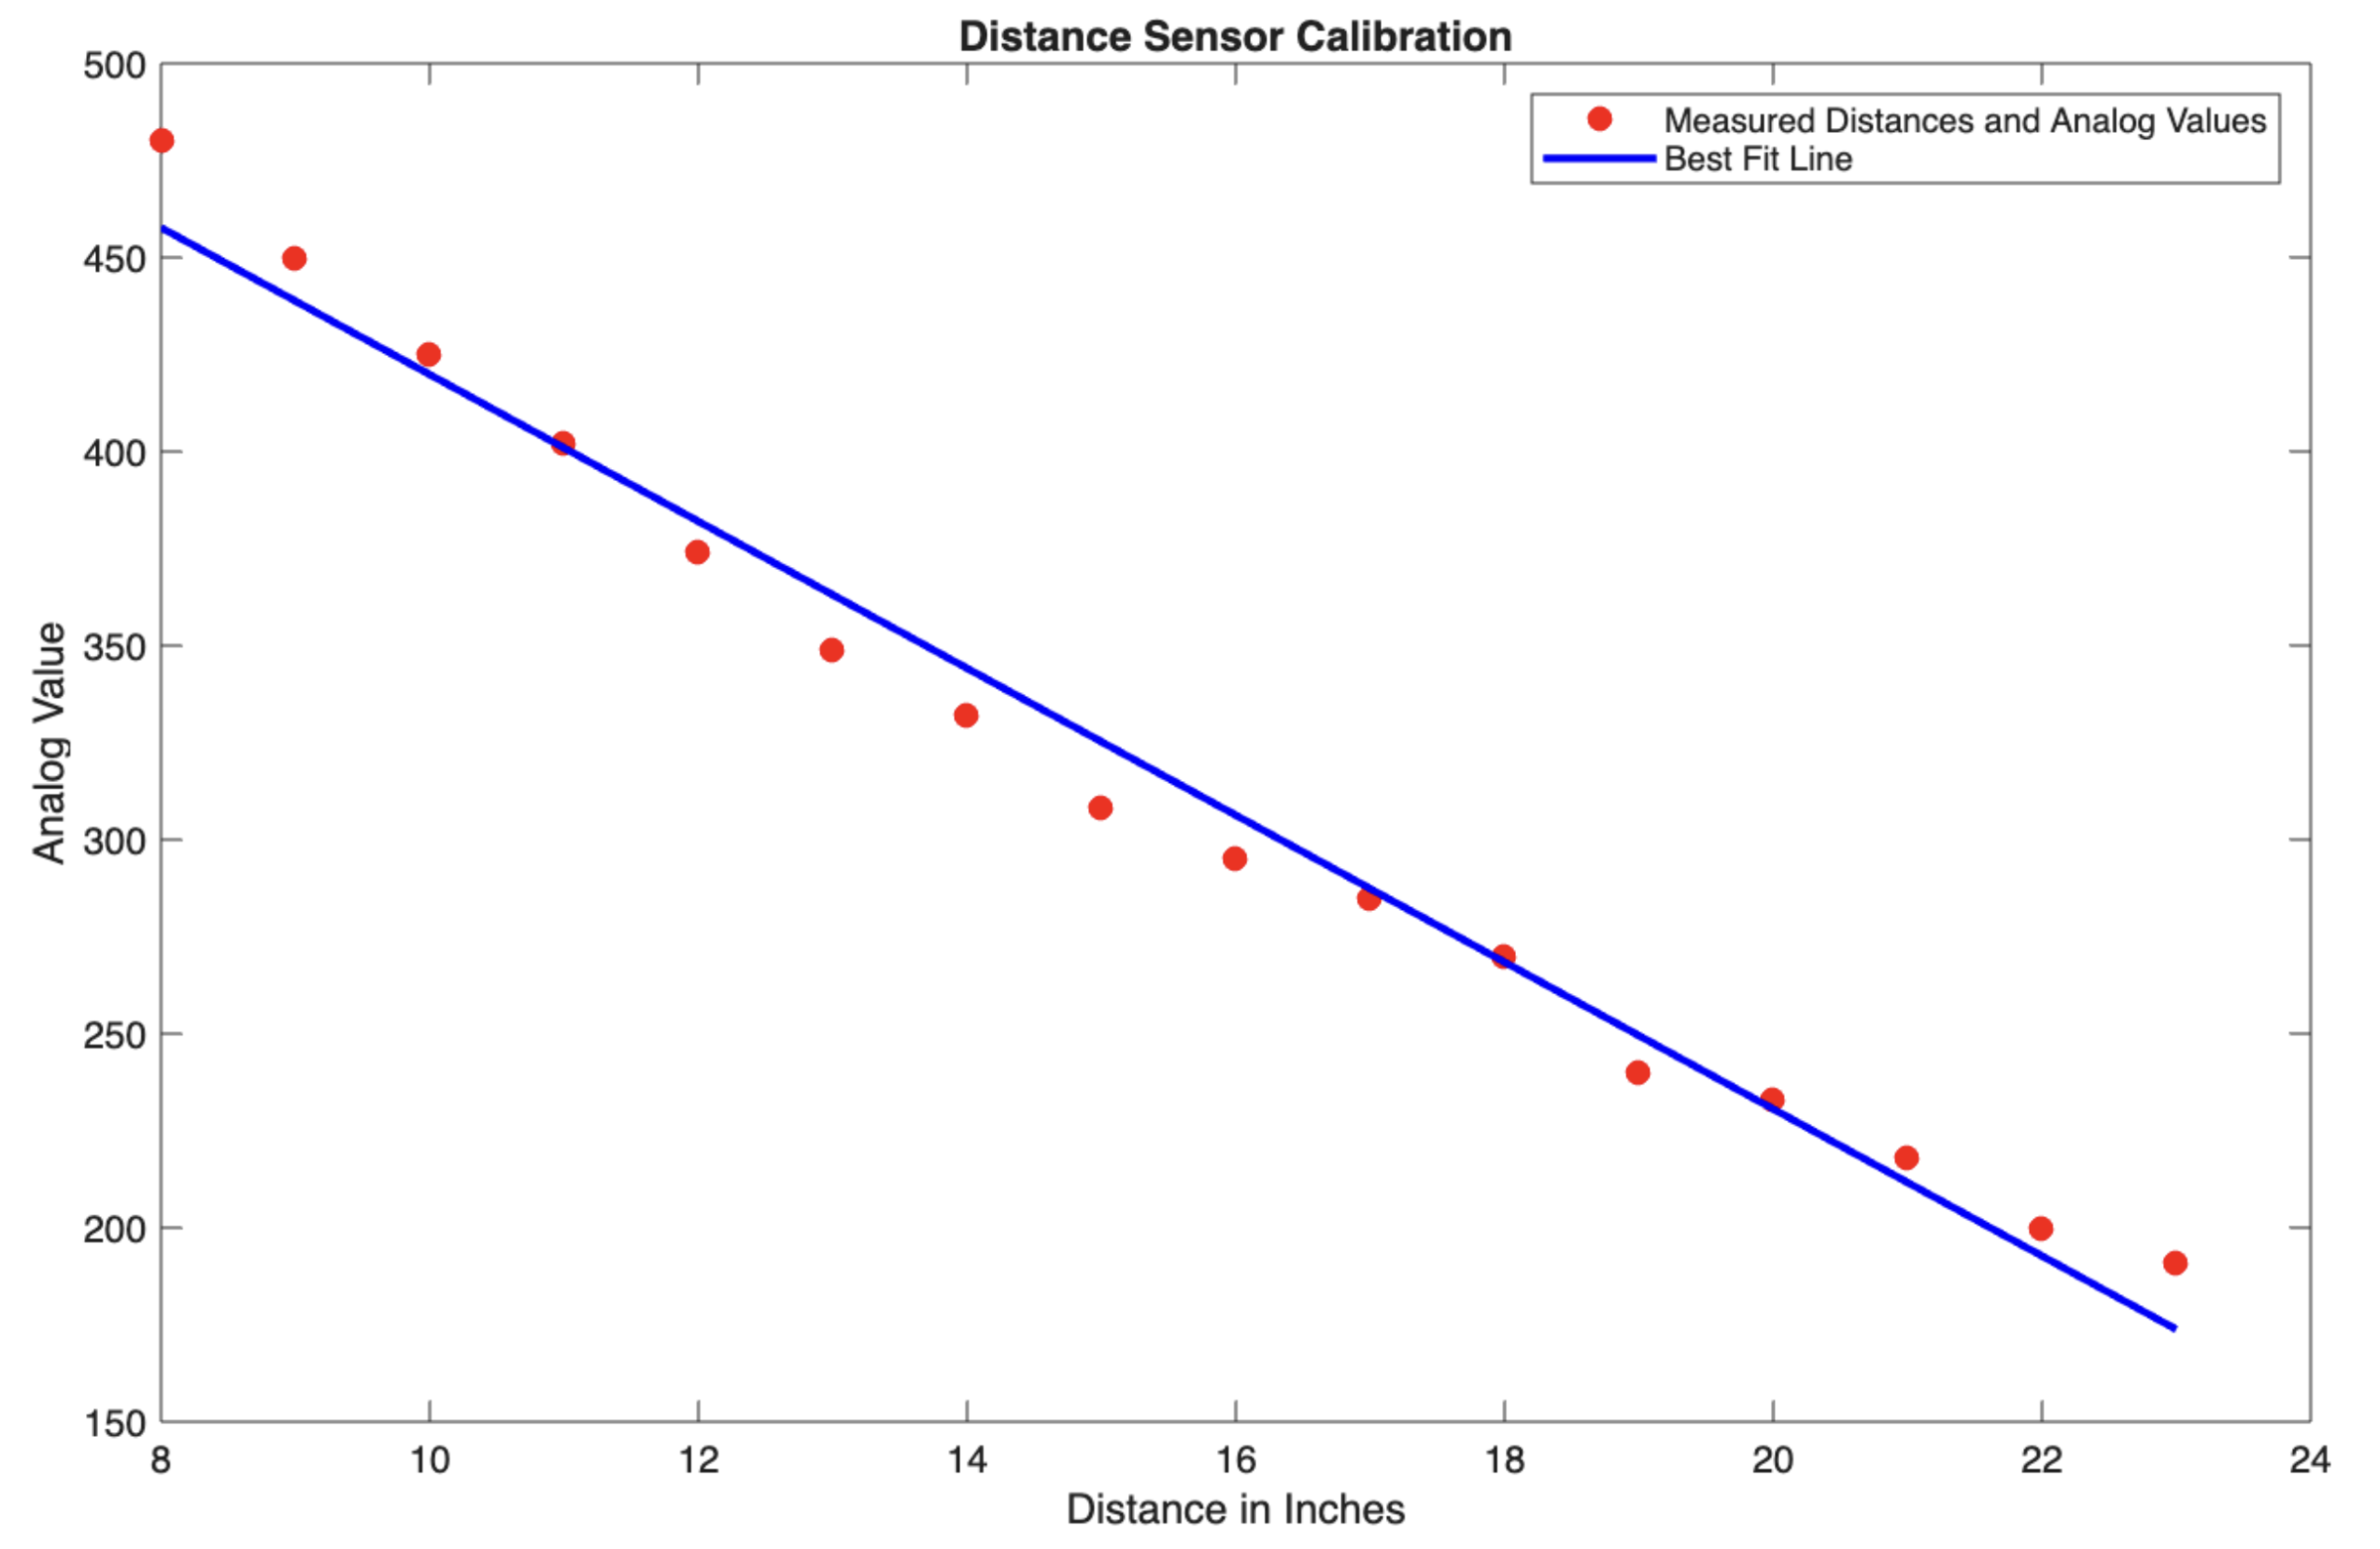
Creating a Best-Fit Line
We recorded analog readings for a flat object at 1-inch increments, from 8 to 23 inches. These points were plotted in MATLAB, and we used linear regression to generate a best-fit line. The data showed a strong linear relationship, validating our choice of a linear approximation to convert analog values into inches for our final scan.
Final Scan Results
The final output of the project is a 3D heatmap generated in MATLAB, which visually represents the scanned object. The color of each pixel corresponds to the distance measured at that X-Y coordinate.
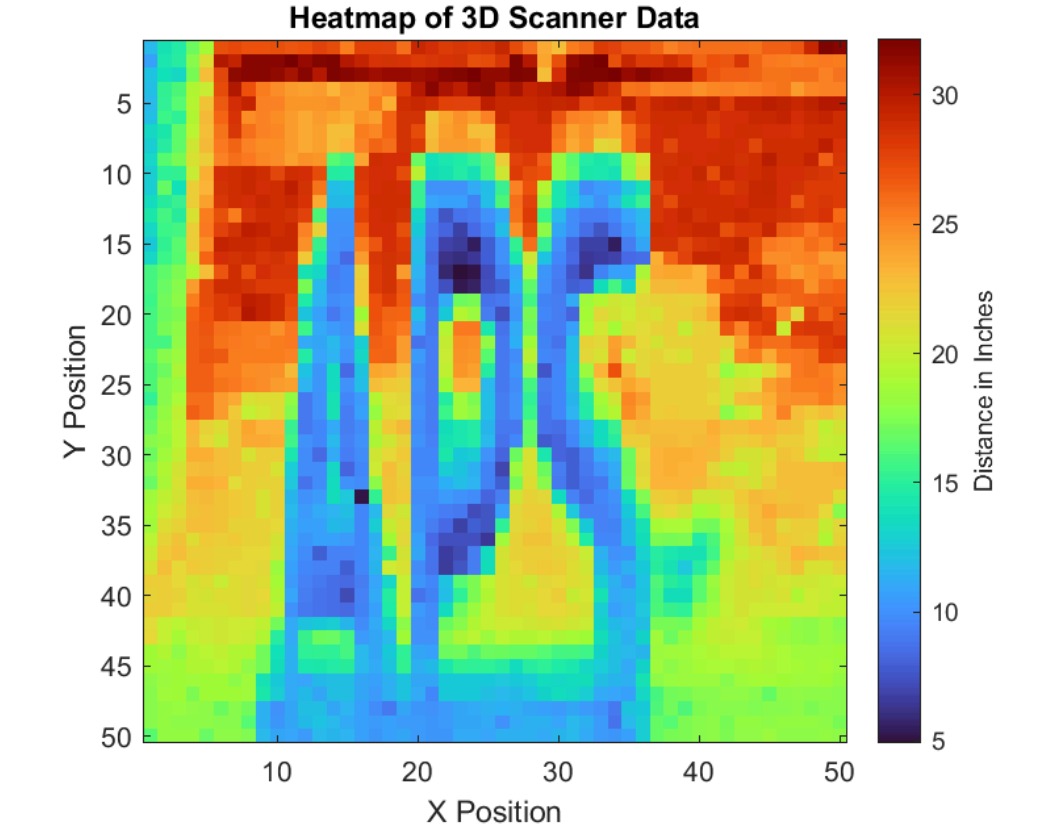
Visualizing the Data
The heatmap clearly shows the shape of the scanned object (the letters "APS"). The cooler blue and green colors represent areas closer to the scanner, accurately capturing the object's form. The warmer red and orange colors indicate the background, which is further away. This successful visualization demonstrates the effectiveness of the entire system, from mechanical design to sensor calibration.